This week, we wanted to provide you with a more technical, chart-based picture of the gold price. Some of you love analysing the charts, and in this vein, please find below a guest appearance analysis from our finance student and whizkid, Gideon Frylinck.
Time of Writing: 08:00, SAST, April 26, 2024
XAU/USD = $2338
USD/ZAR = R19.08
The recent performance of Gold (XAU/USD) has shown a slight reversal following its test of the US$2,420 immediate resistance - seeing a 2.7% drop on Monday, 22 April. The question is, can the gold bulls maintain the astonishing uptrend established on the 7th of October? Let’s answer this by zooming out and looking at the big picture:
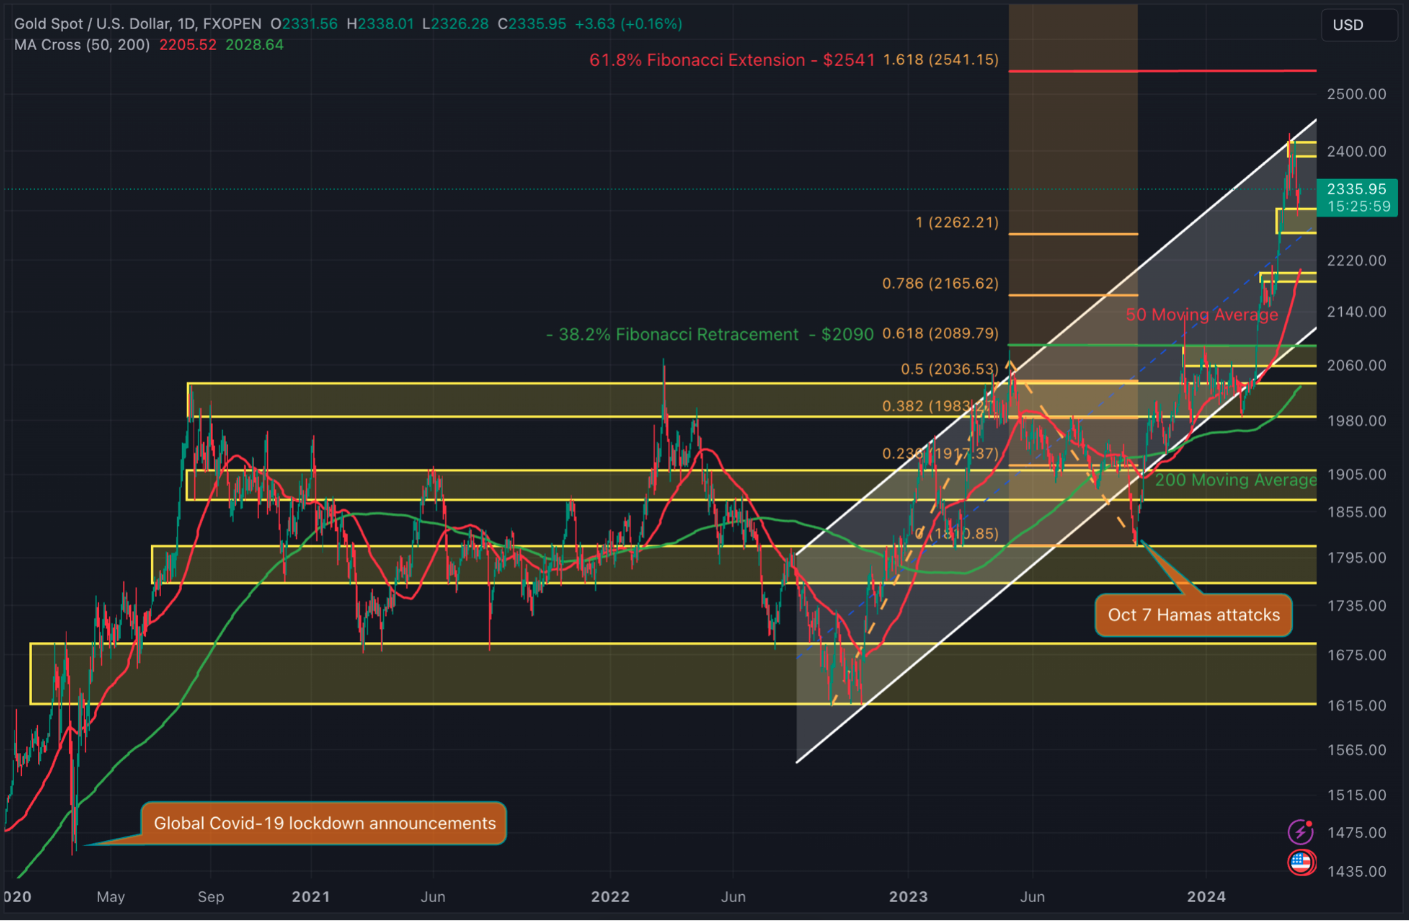
At its newly established all time high of $2,433, Gold has experienced a massive 34% price appreciation. This aggressive bullish move coincided with the October 7, Hamas attacks on Israel. With talks of widespread war being possible, investors across the globe rushed out of risk assets and into the safe haven asset - gold. This knocked the price back into the ascending channel established at the swing low of November 2022 – breaking long-standing resistance levels on its way up.
From a technical perspective, these key levels now act as support, which will safeguard the Bulls as they seek a confirmative break of the newly established high of $2,433/oz. Immediate key support levels are as follow: $2,200, $2,090, $1,868. From a resistance perspective, immediate resistance is at $2,420, and a medium-term resistance setting in at the 61.8% Fibonacci extension level of $2,541 – primarily due to price discovery.
The above-mentioned levels (marked in yellow on the graph above) often form a zone known as a supply and demand zone, which can be used to accurately determine which areas of price the Bulls are most likely to take control over and safeguard the price. Inversely, a break below the above-mentioned levels will allow the Bears to step in and possibly take control.
When taking a medium-term technical outlook, gold is trading below its 50-day moving average, which aligns with its immediate pivotal resistance of $2,420. On the larger timeframe, this zone is also defined by the current major ascending channel’s upper boundary ranging from 28 September 2022.
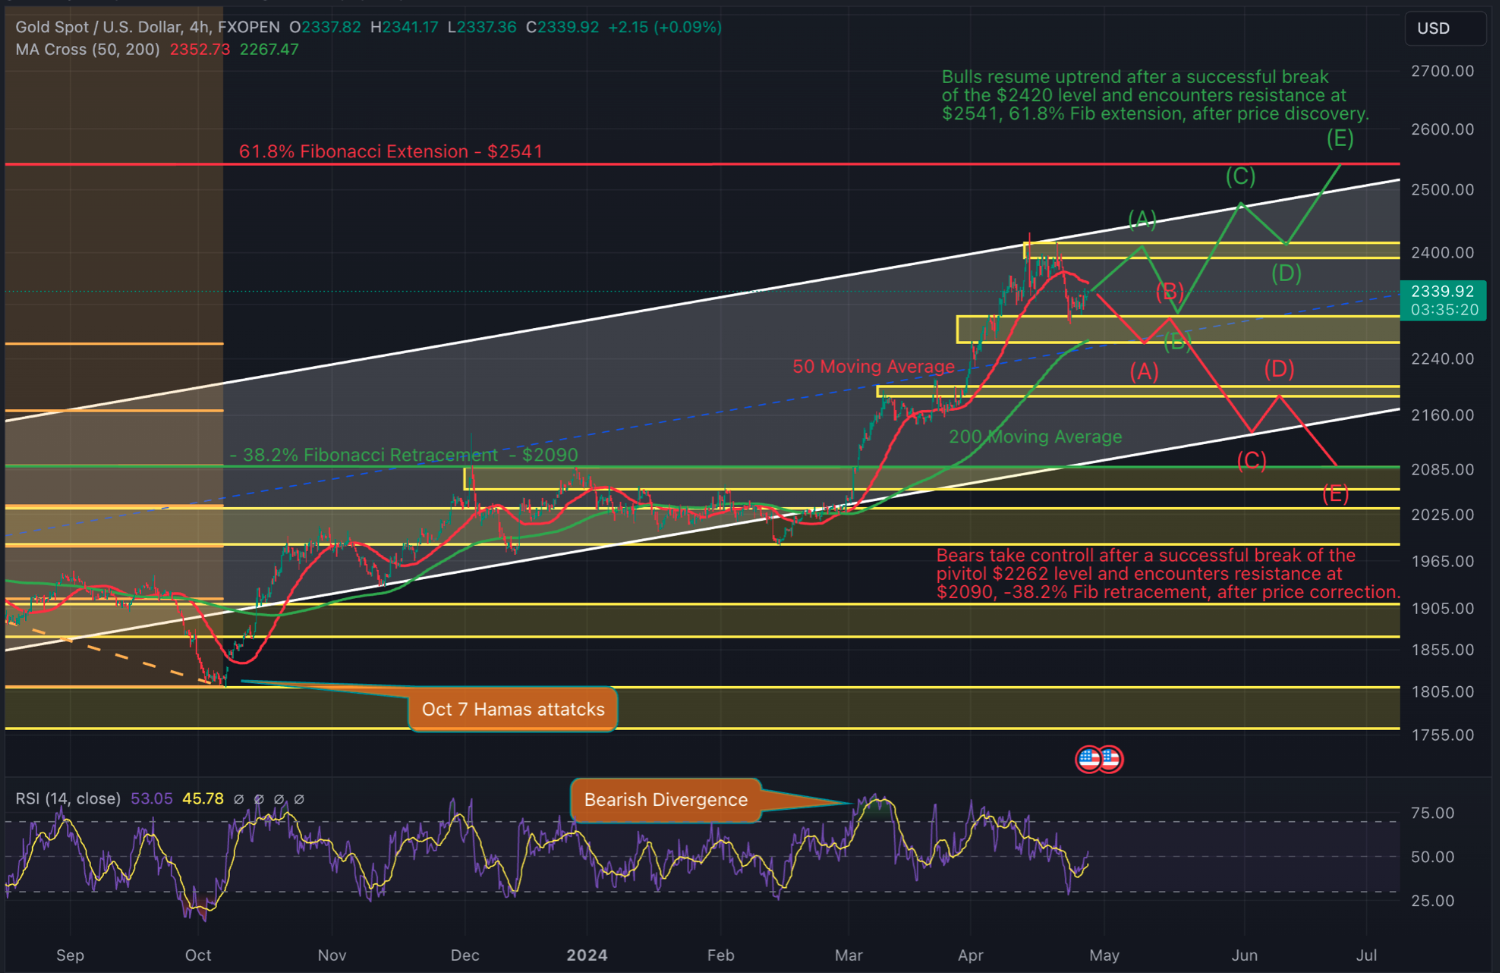
The daily RSI momentum indicator resides below the parallel 50 level, indicating the medium-term reversal from the 12 April high. However, it is important to note that a bullish cross can be identified on the medium-term timeframe, that might indicate an imminent test of immediate resistance level established at $2,420. The bearish divergence marked on the chart above shows that the Bulls are dominating the market, as there has been almost no retracement seen after the flashing of this bearish indicator, further proving the strength of the Bulls in the market.A move above US$2,420 could lead to test the next medium-term resistance at US$2,540. Conversely, a break below the US$2,200 lower limit of the key medium-term pivotal support zone would extend the ongoing corrective decline within the major uptrend phase, potentially targeting the long-term pivotal support zone around $2,090.
Scenario 1 - Gold's price could most likely continue to rise due to the recent escalation from Iran in Middle East tensions, breaking the $2420 resistance and exiting the ascending channel, but facing tough resistance at pivotal Fibonacci $2,541 level.Scenario 2 - If US rates remain stable and relative peace is maintained, Gold should continue its steady climb within the established ascending channel.
Scenario 3 - A significant correction in Gold's price to the $2,090 level would likely occur if the Middle East conflict ends completely, together with an urgent adjustment within US federal monetary and fiscal policy.