What’s been Happening
Fed vs. Treasury: A Widening Policy Rift –
Fed Chair Kevin Warsh’s Jackson Hole keynote on 28 August sharpened his inflation warning considerably, calling price data “more concerning” and declining to rule out a rate hike – this notably hawkish tone pushed fed funds futures to price roughly a 70% chance of a September rate hike. So the markets expect him to raise interest rates. Contrary to Warsh’s tough talk, the Fed has been expanding its balance sheet again – to $6.7 trillion as of 19 August, over $112bn higher than a year ago. That’s expanding the money supply while acting as if you’re concerned about inflation (which comes from increasing the money supply).
Meanwhile, U.S Treasury Secretary Scott Bessent, has spent recent weeks trying to do the opposite: bring long-end yields down. On 19 August, the Treasury doubled its buyback operation for 10–20-year and 20–30-year U.S government debt (from $2bn to $4bn per operation, running 9 September to 4 November). This is a direct attempt to manage the shape of the interest rate curve toward lower rates –which critics have likened to yield curve control. Bessent also wants to tap into the Treasury’s roughly $1 trillion General Account to fund further buybacks.
The market isn’t buying it. Long-end yields have kept climbing all week: the 10-year Treasury yield hit 4.80% on Tuesday – its highest level since November 2023, as part of a broader global bond sell-off – and the 30-year is now at 5.29%, both fresh highs for the year. Treasury is effectively fighting the Fed’s own hawkish messaging with its own balance sheet. Commentator Peter Schiff has pointed to this underlying tension, a nominally hawkish Fed presiding over a growing balance sheet alongside a Treasury actively trying to suppress its own borrowing costs, a textbook setup for the debasement trade that has underpinned gold’s multi-year run – calling it ‘Stealth QE’.
Middle East Conflict and Oil Up, Hormuz Still Contested –
The Iran conflict, which began 28 February, passed its six-month mark on 28 August with no durable resolution. Iran maintains the Strait of Hormuz remains under its control and that any vessel transiting does so only “in coordination” with Tehran; U.S. Central Command disputes this, insisting the strait is international waters that commercial vessels continue to use. The truth sits somewhere in between and shipping through the strait remains well below normal levels.
Iran and Oman spent early August negotiating a temporary shipping corridor through the strait, and the conflict appeared to be cooling. That didn’t last. By late August the Trump administration had rolled out a fresh, broader sanctions package targeting Iran – which Treasury Secretary Bessent previewed as an “economic D-Day.” Iran’s Foreign Ministry says it won’t fully reopen Hormuz until the U.S. lifts its naval blockade – and that Iran won’t yield under pressure.
Oil and refined petroleum products have tracked every twist: Brent climbed to near $90/barrel in mid-August on the shipping attacks, with Goldman Sachs indicating that diesel crack spread – the margin refiners make turning crude into diesel – hit an all-time high in August. They argue for diesel-driven cost push inflation in freight, agriculture, manufacturing etc.
South African Inflation Eases, Rand Firms –
South African data has turned more favourable. Headline CPI eased sharply to 4.3% year-on-year in July, down from June’s 5.0% and below the 4.5% economists expected, helped by softer food inflation, smaller municipal tariff increases and falling fuel prices.
The Rand firmed to around R16.15/USD in late August – its strongest level since early March – supported both by the softer local inflation print and by dollar weakness at the time. That dollar weakness has since reversed as US yields have surged this week, so it’s worth watching whether the Rand gives back some of that strength alongside the broader risk-off, higher-for-longer repricing. The SARB is still expected to hold its repo rate at 7% through most of the year, with a possible 25 basis point cut pencilled in for the final quarter.
What’s Happening to Gold
Gold was resilient at the $4,000/oz price level, strengthening on good fundamentals to $4,300 then $4,600/oz in August. Having rallied as much as 15% off its mid-July low near $4,000/oz to touch a three-month high around $4,650/oz last Thursday, the metal has given back a chunk of its August rally– sliding through $4,400 on Monday, $4,375 on Tuesday, and trading around $4,303/oz today, down about 7% from last week’s peak, after a 15% rise. Gold closed out August up 9.6% on the month – its best month since January – so this reads more like a sharp repricing of Fed odds than a reversal of the broader trend.
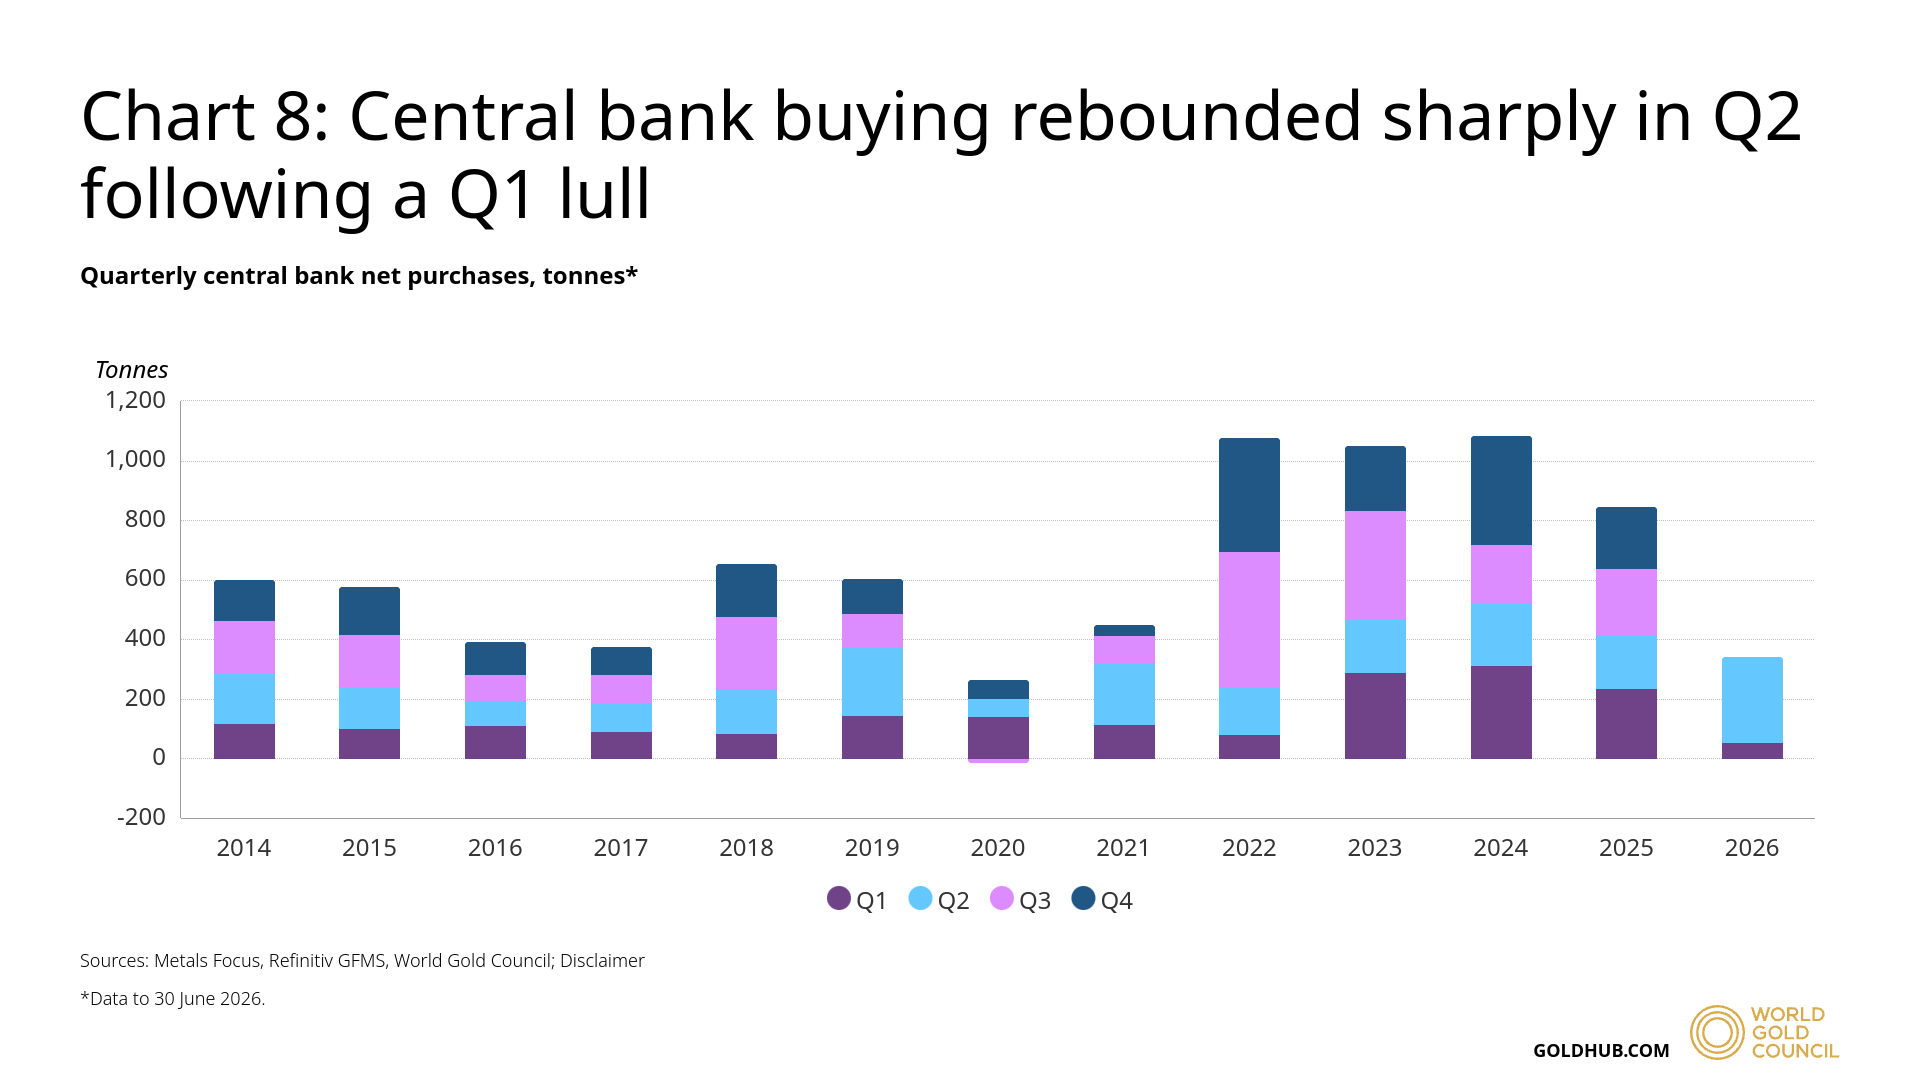
The World Gold Council’s Q2 2026 Gold Demand Trends report, released 30 July, shows that the structural story remains intact. Total demand held essentially flat year-on-year at 1,269 tonnes in Q2, but central banks were the standout: they bought 289 tonnes, snapping back sharply after a downwardly-revised, unusually quiet Q1 (56.5t) to the kind of pace that’s been typical for the past four years. That helped offset continued ETF selling (-44.8 tonnes in Q2) as North American investors in particular adjusted to higher-for-longer rate expectations and a firmer dollar. First-half demand in value terms hit a record $380 billion!
Goldman Sachs Research still forecasts gold will reach $4,900/oz by year-end, citing continued central bank diversification and fading expectations of further Fed hikes (calling Warsh’s bluff!) as the key drivers – though this week’s move is precisely the kind of two-way risk Goldman flagged to its own forecast. Goldman’s nowcast shows central bank buying accelerating to an estimated 100 tonnes a month in June (three-month seasonally adjusted basis), with China the largest identifiable buyer.
Zooming out further, UBS struck a similar tone this month, telling clients to “position for a commodity upcycle” – not gold alone, but a broader structural move across precious metals, energy, industrial metals and agriculture, driven by electrification, AI infrastructure buildout and years of underinvestment. The Quantix Commodity Index has surged more than 22% since late June alone. UBS remains “constructive on gold prices over the next 12 months,” still citing central bank demand, de-dollarisation and global debt concerns as the core structural pillars.
So, the structural case remains what it’s been all year: persistent central bank buying, an unresolved sovereign debt and de-dollarisation story, and now a broader commodity supercycle narrative gaining traction beyond gold alone. The catalysts to watch from here: the delayed August jobs report this Friday, 4 September; the Fed’s 16 September decision, now a genuine swing risk after Jackson Hole; and whatever comes of the renewed Iran sanctions and the state of the Strait of Hormuz.
The yellow metal was last seen trading at $4,337/oz.
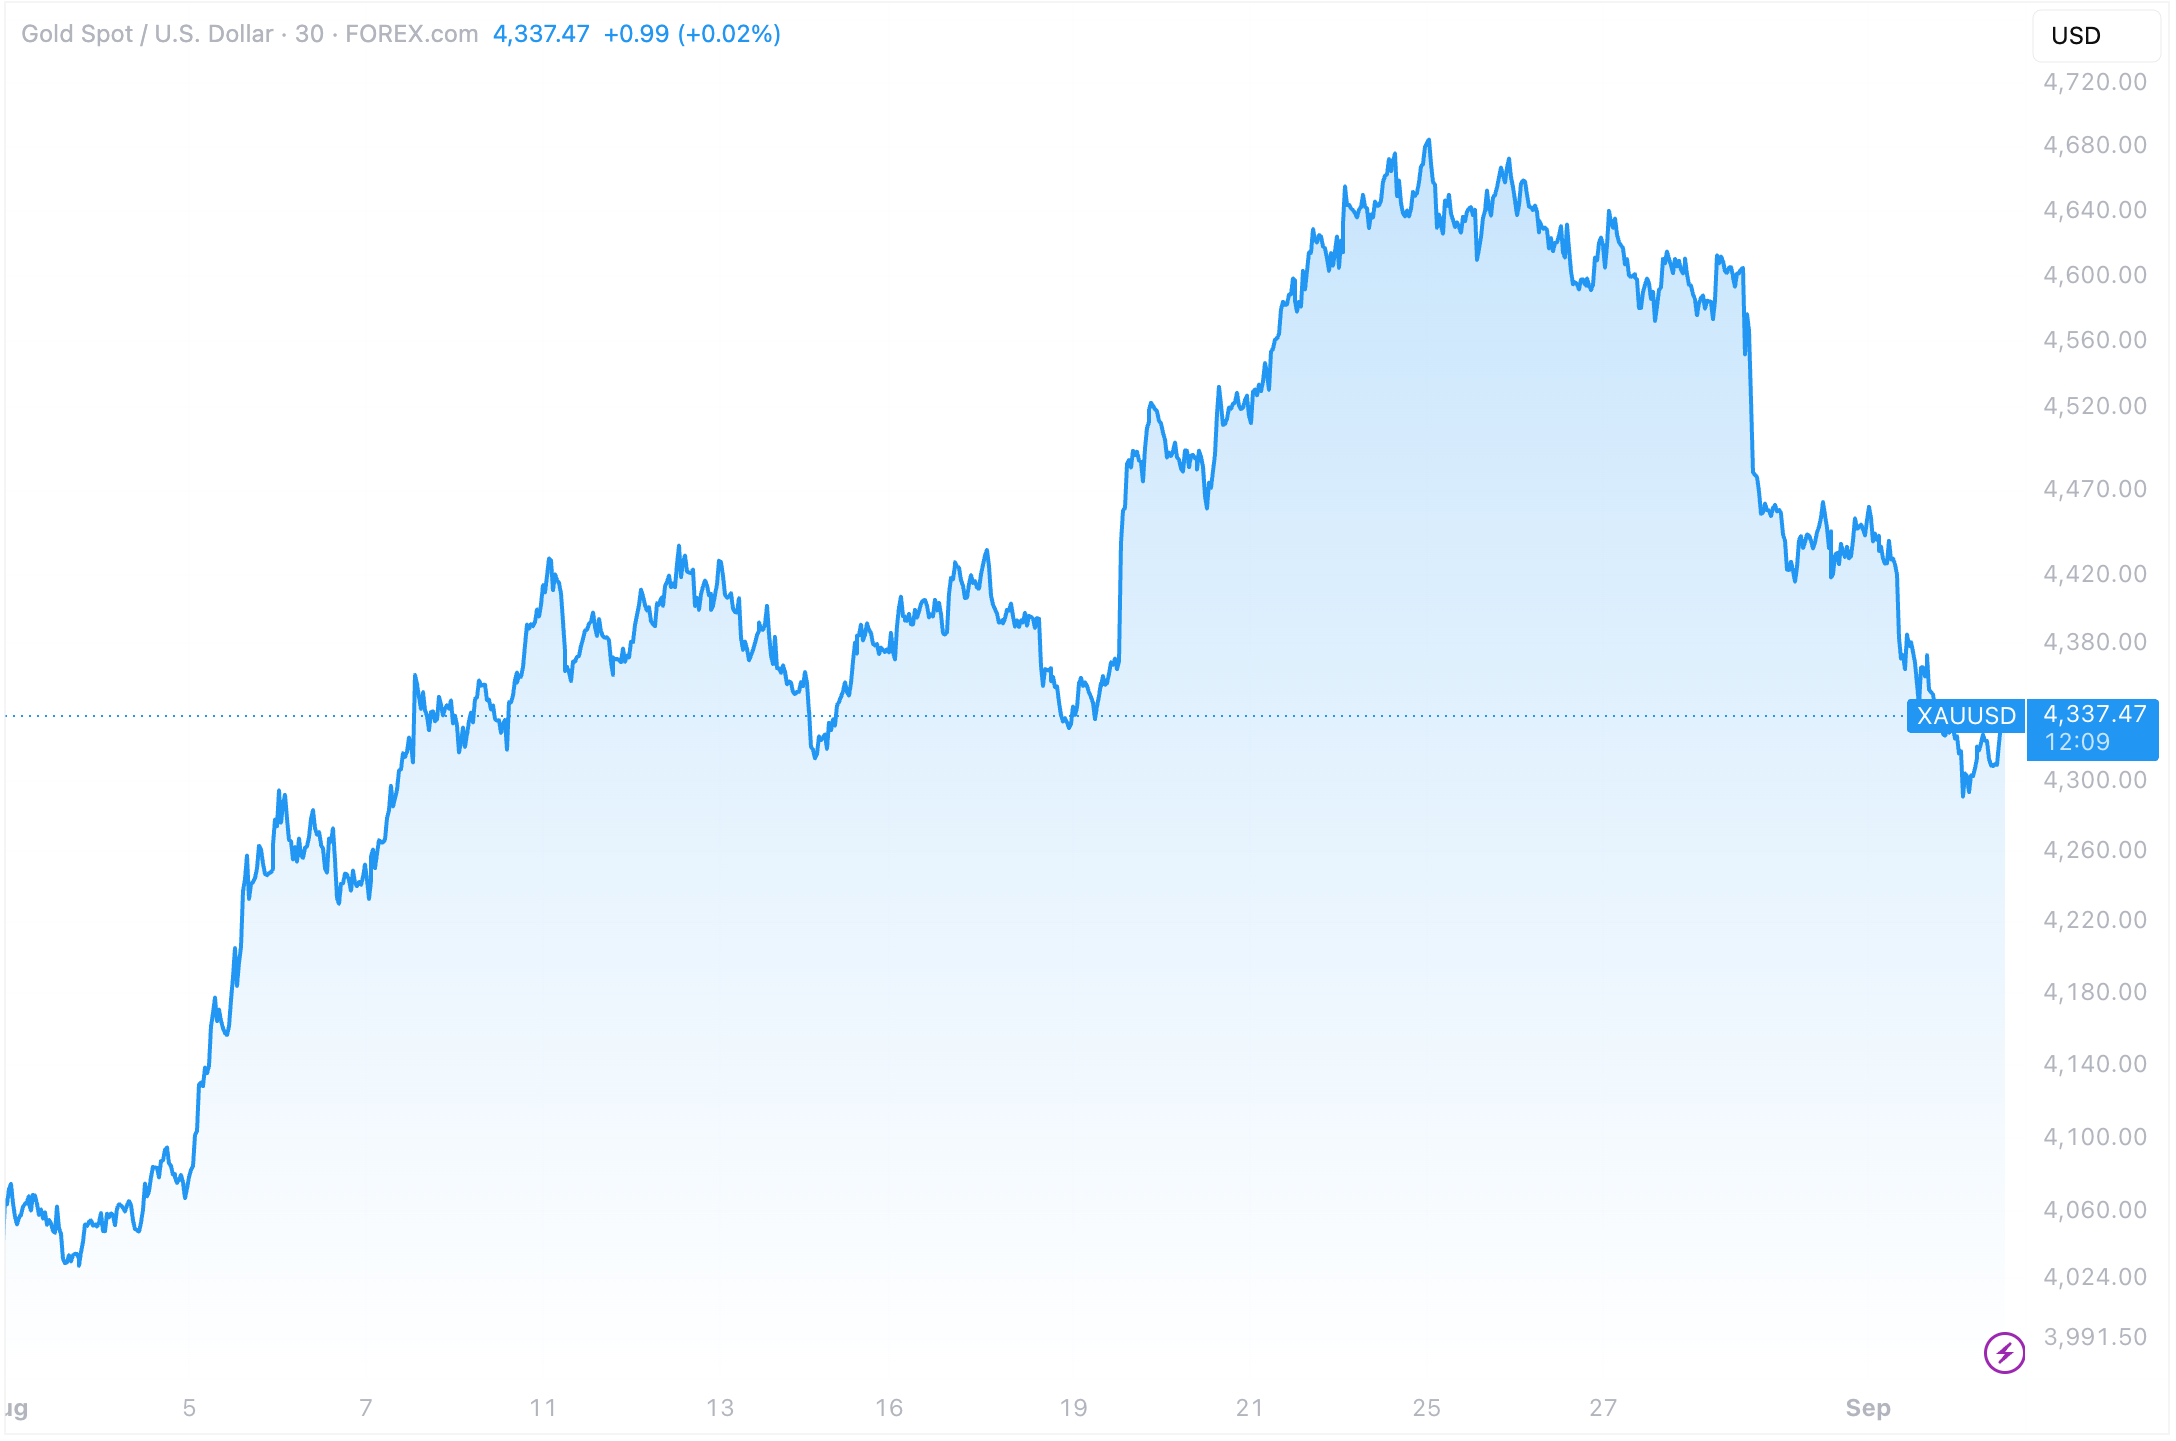
Source: TradingView – XAUUSD (1 month), 2 September 2026.