What’s been Happening
High Oil & Diesel Prices on Artificial Supply Constraints Driving Inflation –
US diesel prices crossed $6 a gallon for the first time ever on 11 September, with the national average hitting $6.0556/gallon and prices in California nearing $8. Since the Iran war began in late February, the nationwide diesel price has risen 60%; Brown University estimates the higher fuel costs have already cost US consumers more than $46 billion, with roughly a fifth of that concentrated in Texas and California alone.
The immediate trigger was an escalation well beyond Hormuz itself. On 10–11 September, drone strikes launched from Iraqi territory hit Saudi Arabia’s East-West Crude Oil Pipeline, damaging two pumping stations and forcing Saudi Aramco to shut the line as a precaution. That pipeline is the kingdom’s main workaround for routing roughly 5 million barrels a day to the Red Sea while the Strait of Hormuz remains effectively closed – so taking it offline removed one of the few remaining release valves in the system. Aramco has already told at least two European refiners they’ll receive no Saudi crude next month, and the pipeline is expected to be mostly out of service for several weeks. President Trump said Iran was “probably” behind the attack.
Oil spiked hard on the news – Brent pushed as high as $109 and WTI toward $102–105 through the middle of the month – before paring some of those gains as the rally started to look overdone and US inventory data ticked higher. Even so, both benchmarks remain well above pre-attack levels. Notably, China’s yuan-denominated crude futures hit a record high on the Shanghai International Energy Exchange around the same time, as refiners in the world’s largest importer bought up cargoes – another sign that Asian buyers are leaning into the supply squeeze rather than away from it. With diesel now a genuine political and economic flashpoint, expect these elevated fuel costs to keep feeding through into freight, agriculture and manufacturing prices well into next year.
Fed Rate Hike Mock-Charge as Bond Yields Keep Rising and the Reflation Trade Takes Hold –
On 16 September, the Fed hiked the federal funds rate by 25 basis points to 3.75%–4.00% – its first hike since July 2023. The committee’s statement said “inflation remains elevated,” officials revised their headline inflation forecast up to 3.7%, with year-end projections clustering at 4.1%–4.4%.
The bond market treated it as a mock-charge. The 10-year Treasury yield had already topped 5.04% ahead of the decision – its highest level since 2007. The bigger story isn’t the 25 basis points; it’s that long bond yields are being driven by a reflation and supply story the Fed doesn’t fully control. US national debt has now passed $40 trillion, roughly $8.4 trillion of Treasury securities are scheduled to roll over between now and year-end, and heavy government issuance is competing directly with a wall of corporate borrowing for investor demand. Deficits simply aren’t slowing down, hike or no hike.
Peter Schiff has recently argued a 25bp move would do “nothing” and that the Fed “should raise rates by a lot more” if it were serious; after the hike, his read was that the real constraint isn’t caution but capacity – a hike large enough to actually break inflation would break the economy and the Treasury’s ability to fund itself at these debt levels. That’s Schiff’s own framing, not ours, but the underlying tension – a central bank hiking symbolically while fiscal deficits do the real work of debasement – is exactly the setup that’s historically been very good for gold.
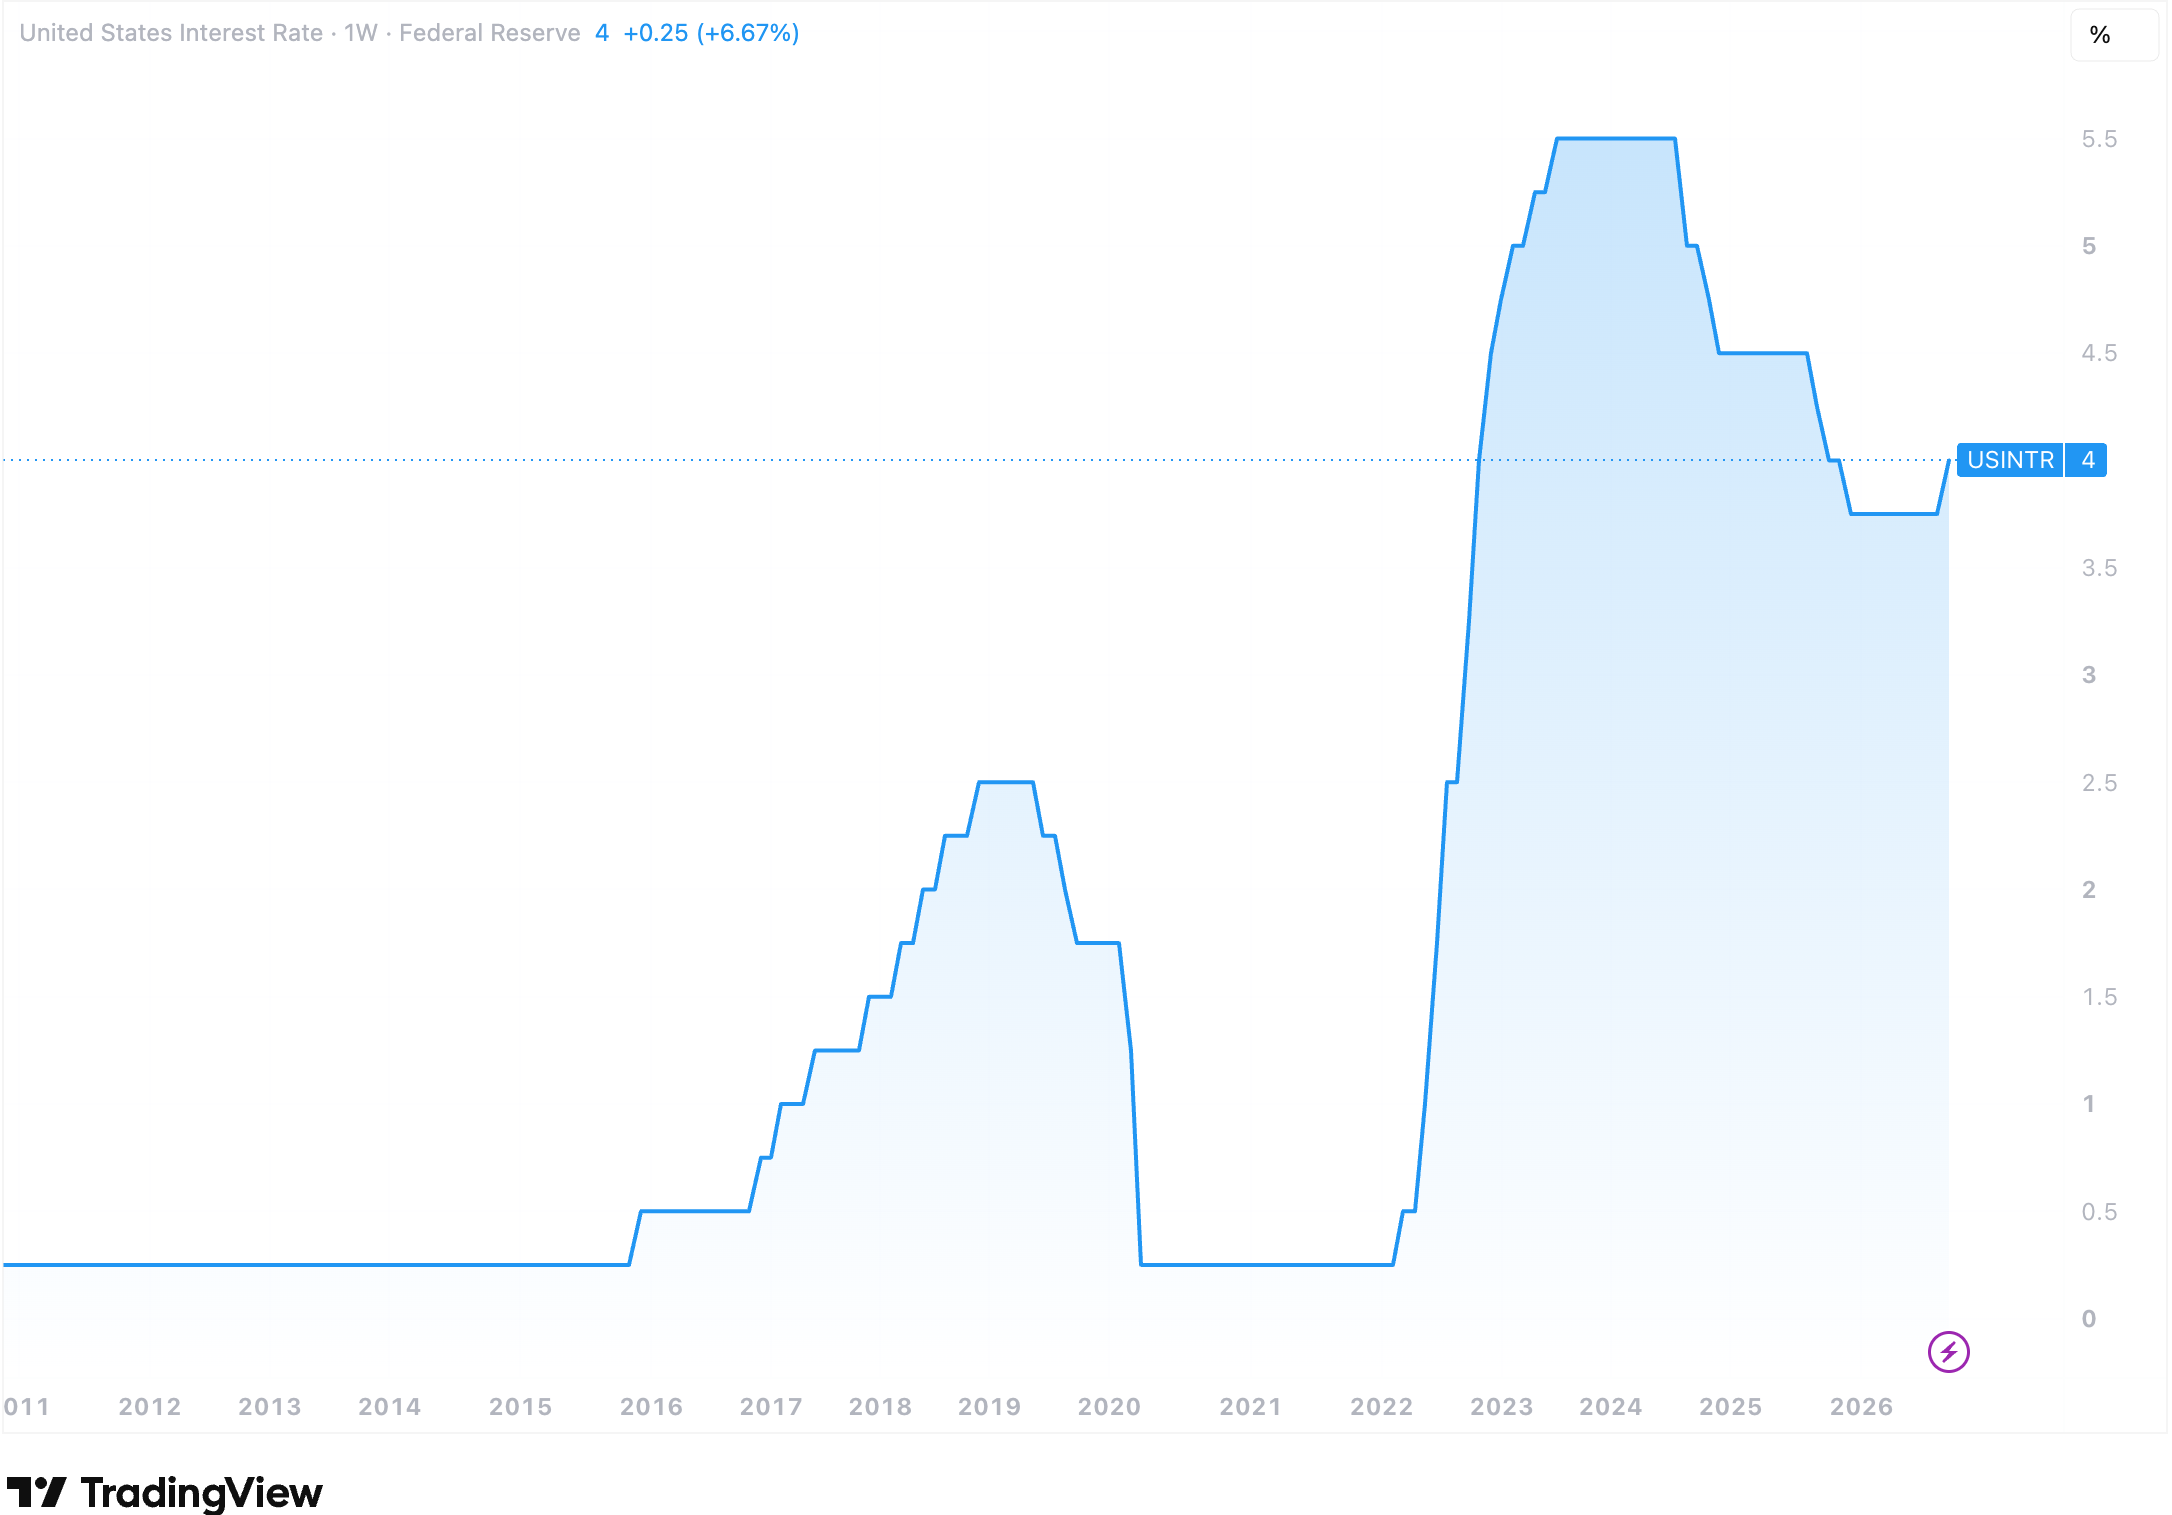
Source: TradingView – US Interest Rate- Federal Reserve (15 years), 22 September 2026.
US Tech and AI Spend: Cash Flow as a Share of the S&P Keeps Shrinking –
The AI infrastructure build-out is starting to show up in hyperscaler balance sheets in a way that’s hard to ignore. Combined capex across the major cloud players is on pace for roughly $770 billion in 2026 – for the big four alone (Amazon, Microsoft, Alphabet and Meta), spend of around $670 billion equates to more than 90% of their combined operating cash flow.
The earnings-versus-cash divergence is the number worth sitting with: combined net income across the major hyperscalers is projected to rise roughly 25% to about $506 billion this year, while combined free cash flow is projected to fall around 91% to just $16 billion. To keep funding the AI build-out, these companies have leaned harder on debt and equity issuance and pulled back on buybacks; net debt across the group is up roughly $170 billion since the start of 2025, and share counts have started rising again after years of buyback-driven shrinkage.
Reported earnings still look robust – that’s the number the index trades on – but the cash reality underneath it is a textbook capital-misallocation setup: some of the market’s largest, most profitable companies are burning cash and taking on leverage at a pace that requires a very long payback horizon to justify. It doesn’t need to end badly to matter for gold – it just needs equity investors to start pricing in that risk.
What’s Happening to Gold
Gold has genuinely shrugged off this month’s hawkish shock. In the five trading days before the 16 September decision, ETF investors added almost $2 billion to gold funds – a signal the hike was already priced in around $4,300–$4,400/oz. Then, on the decision itself, spot gold surged 2.5% to $4,368.91/oz– a highly counterintuitive move for an asset that’s supposed to dislike rate hikes.
Three forces converged to override the headwind: Treasury yields corrected sharply after their initial post-decision spike, crude oil fell more than 4% as the Saudi-pipeline-driven rally unwound, and gold ETFs logged eight straight sessions of inflows.
China remains the standout recent buyer. The PBoC added 20 tonnes to official reserves in August – its strongest single month since October 2023 – extending a buying streak now running 18–19 consecutive months and taking H1 2026 purchases to roughly 40 tonnes, with the monthly pace climbing from around 1.2 tonnes in January to about 20 tonnes by mid-year. Chinese gold ETFs pulled in close to $9 billion in the first four months of 2026 alone – more than double second-placed India – and the World Gold Council reads this as structural rather than purely cyclical: reserve diversification away from dollar assets, rather than price-chasing.
A smaller but telling story: Venezuela’s 31 tonnes of gold, held in the Bank of England since the UK stopped recognising the Maduro government in 2018, was worth about $1.9 billion when it was effectively frozen and is worth close to $4 billion today. Following the devastating 24 June earthquake, Venezuela’s government and opposition reached a decision to pursue its release for reconstruction funding.
Put together, this month is a good test of the structural bull case rather than a threat to it. A real Fed hike, a 2007-level Treasury yield, and record diesel prices would normally be a rough combination for gold – instead, the metal absorbed all three and pushed back toward its highs, while central banks and reserve managers keep buying regardless of where the price sits day to day. Catalysts to watch from here: how quickly the Saudi pipeline comes back online, the next CPI print, hyperscaler Q3 earnings for an update on the capex-versus-cash-flow gap, and the broader Iran conflict.
The yellow metal was last seen trading at $4,321/oz.
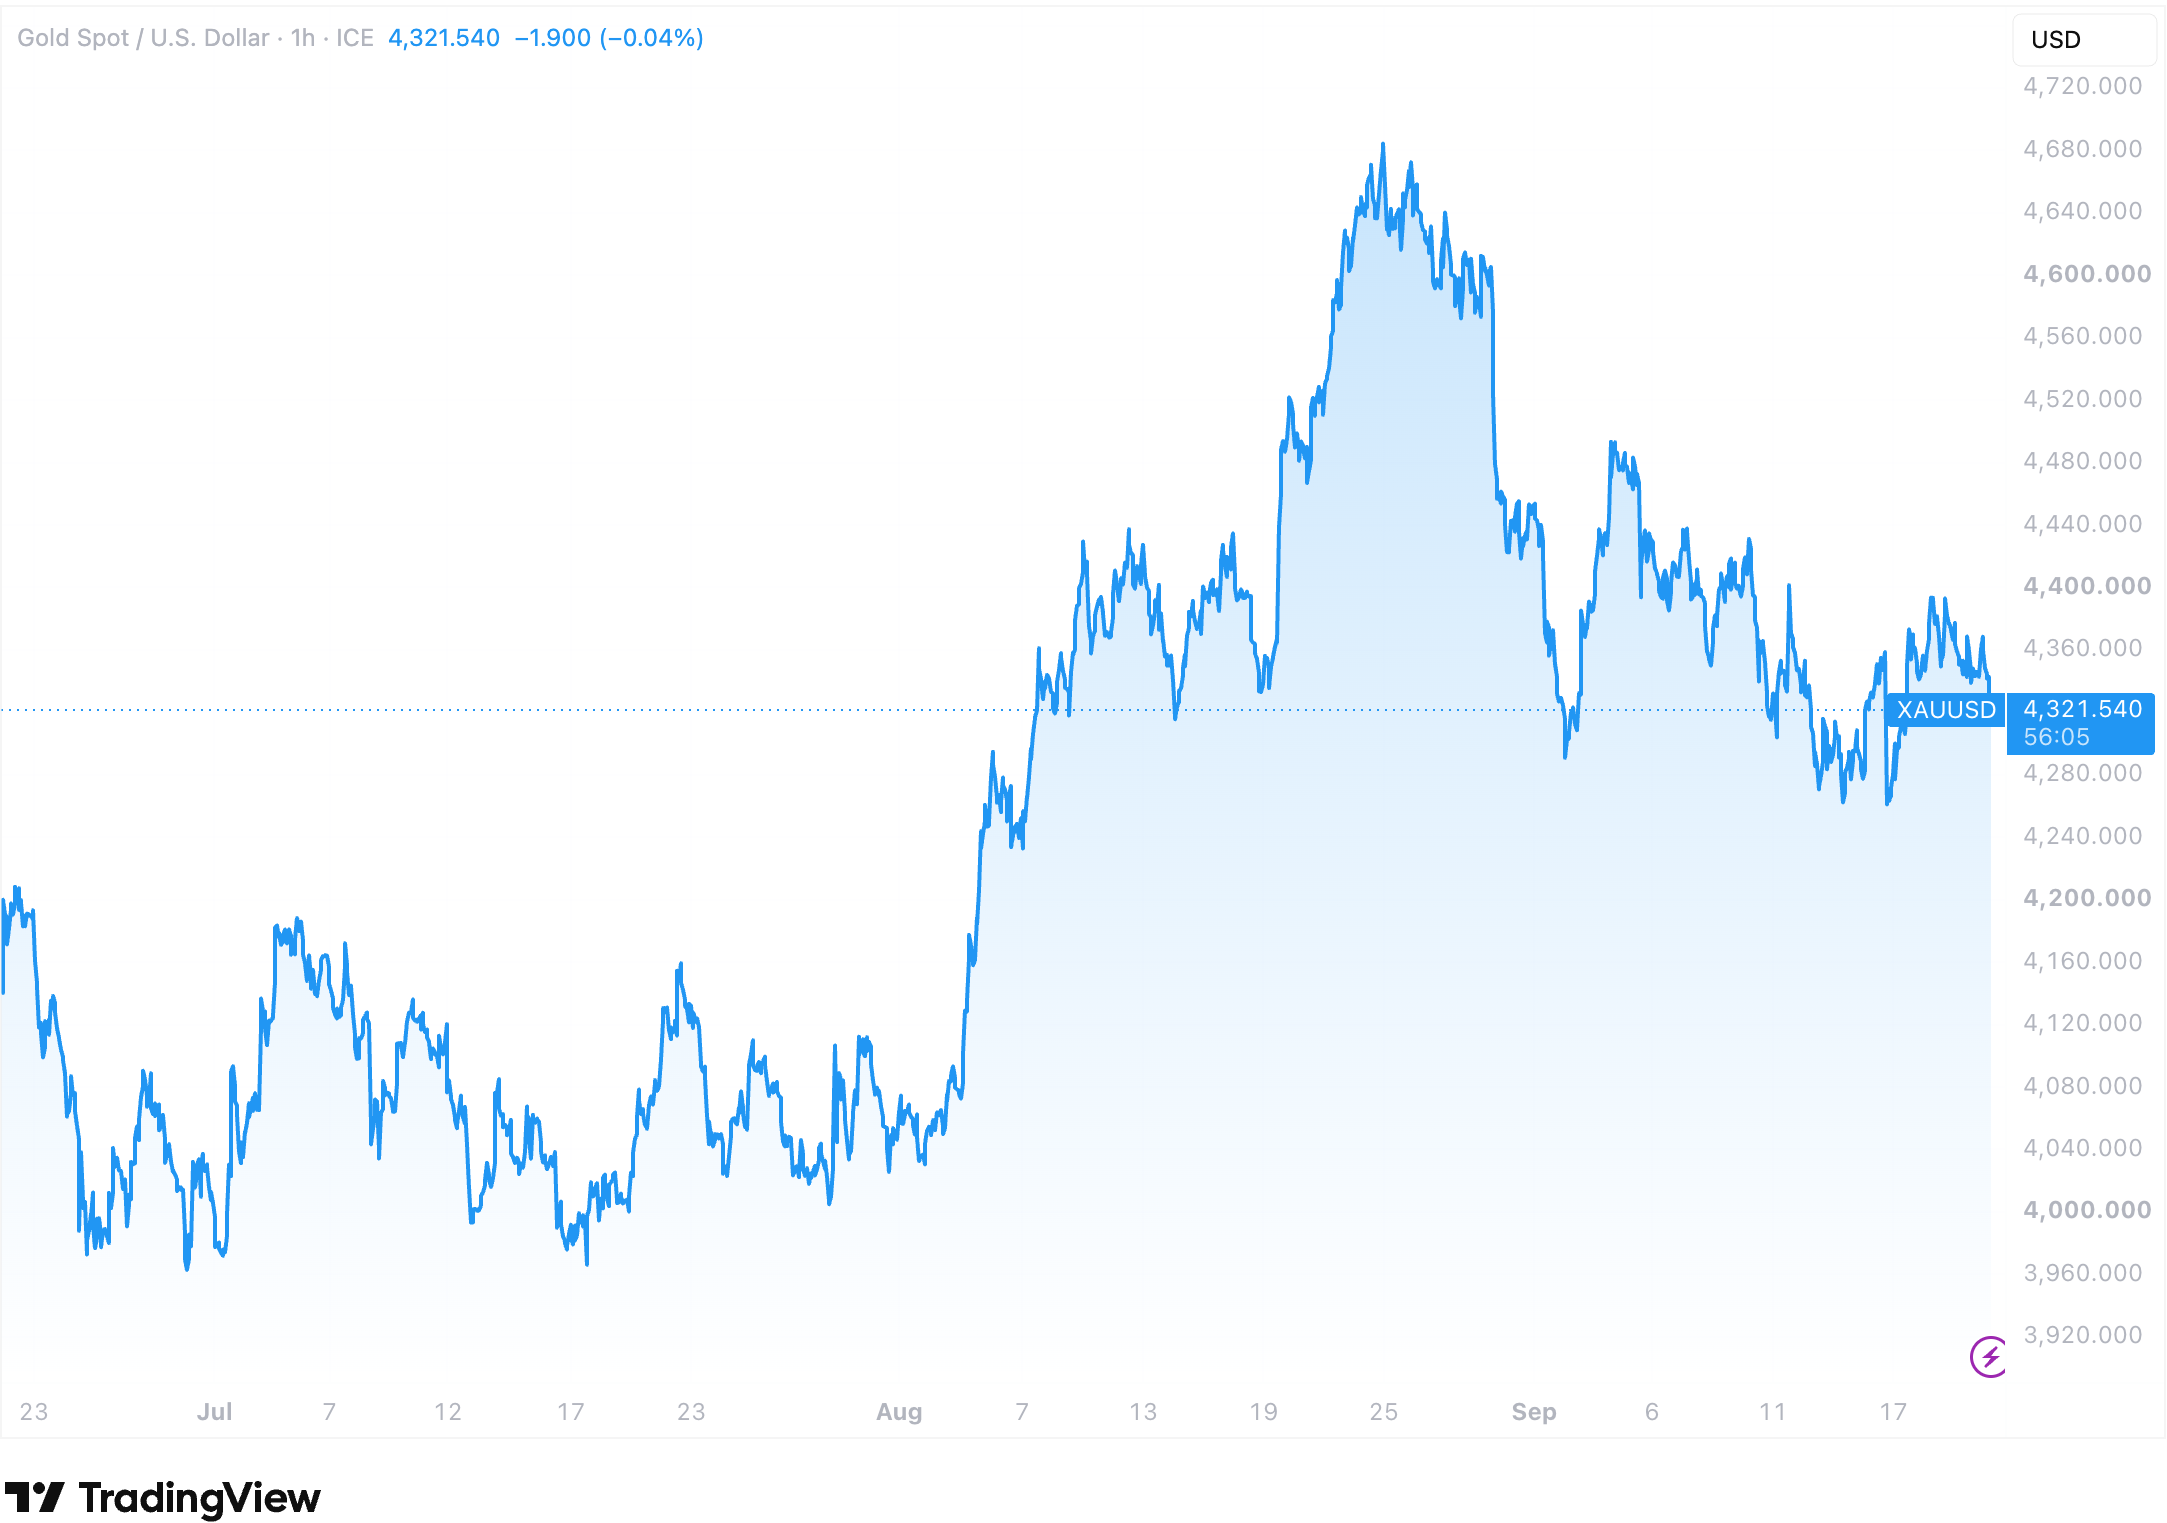
Source: TradingView – XAUUSD (3 month), 22 September 2026.