What’s been Happening
Geopolitical Conflict & Oil Price-Driven Inflation –
On 17 June, President Trump and Iranian President Masoud Pezeshkian signed a memorandum of understanding at the Palace of Versailles, ending the war that started in Q1, lifting the U.S. naval blockade of Iran and reopening the Strait of Hormuz. The truce lasted barely three weeks.
The conflict, which started in late February, brought oil shipments going through the world’s most critical thoroughfare down by roughly 90%, and 30% down for the quarter – in turn sending the crude oil price from $65/barrel to over $120 by May. During this time, global markets were forced to utilize and deplete their strategic oil reserves by 25 to 45%. The ceasefire period helped cool the price down to about $80/barrel – but it wasn’t long enough to meaningfully replenish supplies.
Accordingly, it’s predicted these elevated prices in crude and other petroleum-related products will feed into producer prices in agriculture, energy and manufacturing going into 2027 - reviving energy-driven inflation risks for the global economy.
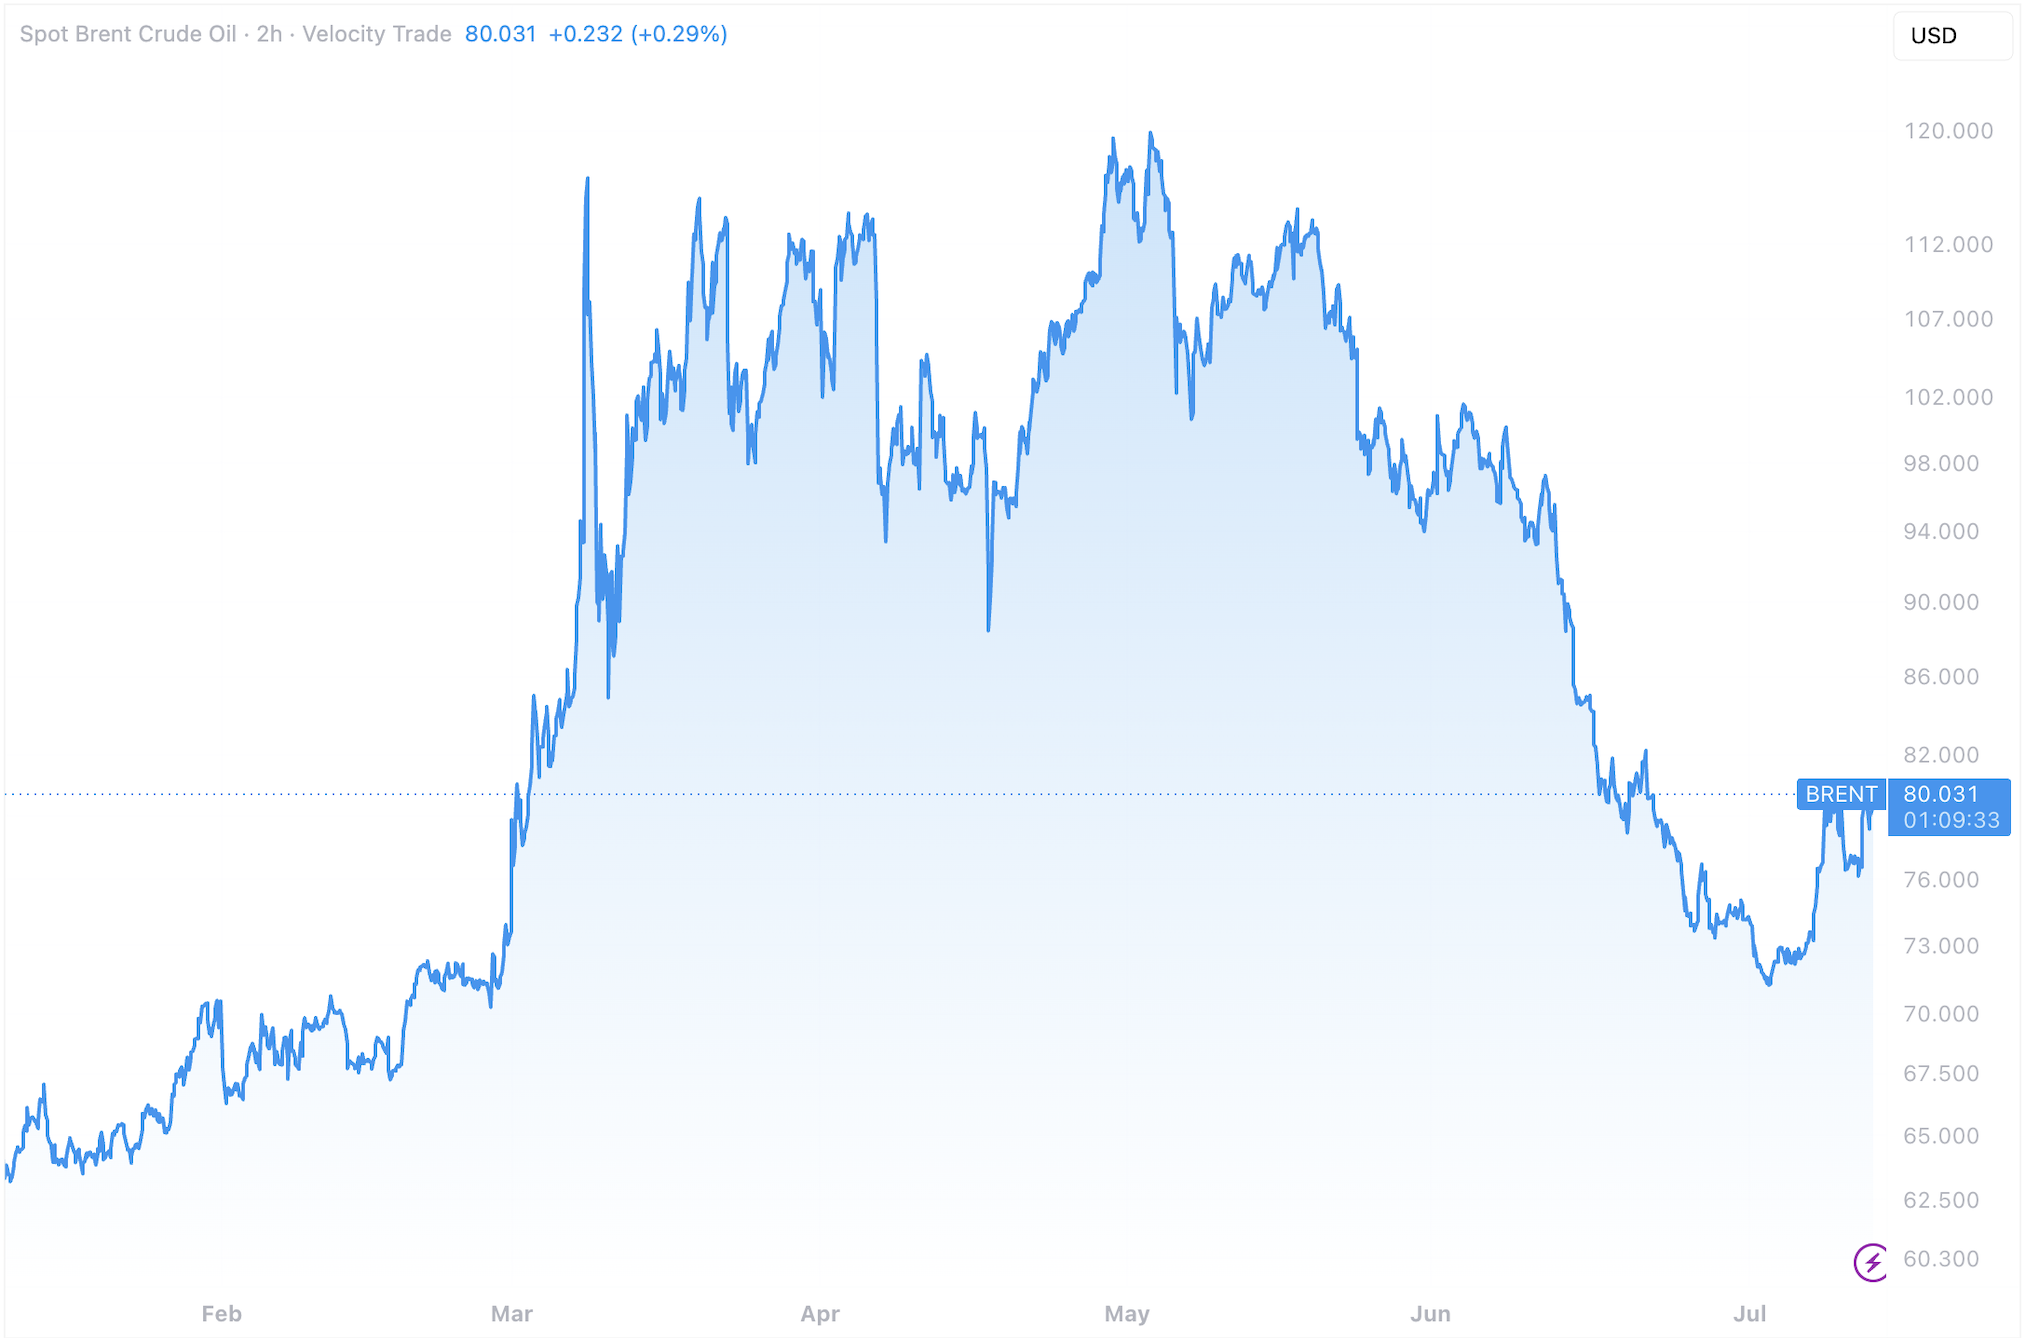
Source: TradingView Spot Brent Crude data – 13 July 2026.
Fed Holds Firm, High Rates & Dollar Reasserts Itself –
New Fed Chair Kevin Warsh’s first meeting in the role, on 17 June, kept the federal funds rate unchanged at 3.50%–3.75% for a fourth consecutive meeting, while dropping language with a rate cut bias – a sharp reversal from the rate-cut expectations that were driving gold higher earlier this year.
That hawkish repricing has pushed the U.S. Dollar Index back above 101 (strengthened), its firmest level since 2023, with renewed Iran conflict now adding a safe-haven bid on top of high USD bond rates. A stronger, higher-yielding dollar via its respective Treasury bond yields, is gold’s most direct competitor as a safe-haven asset, and its resurgence has been the single biggest drag on gold’s ability to hold its rallies in 2026.
As gold doesn’t pay an interest rate, but U.S Dollar bonds do, the real interest rate (nominal rate minus inflation) is the most sensitive variable that affects the gold price. To put today’s high rates into perspective, the 10-Year Treasury bond yielded 0.535% in the Covid depths of 2020, versus today’s 4.597% - a 762% increase in yield. Similarly, the 30-Year has increased from 1.175% to 5.092%.
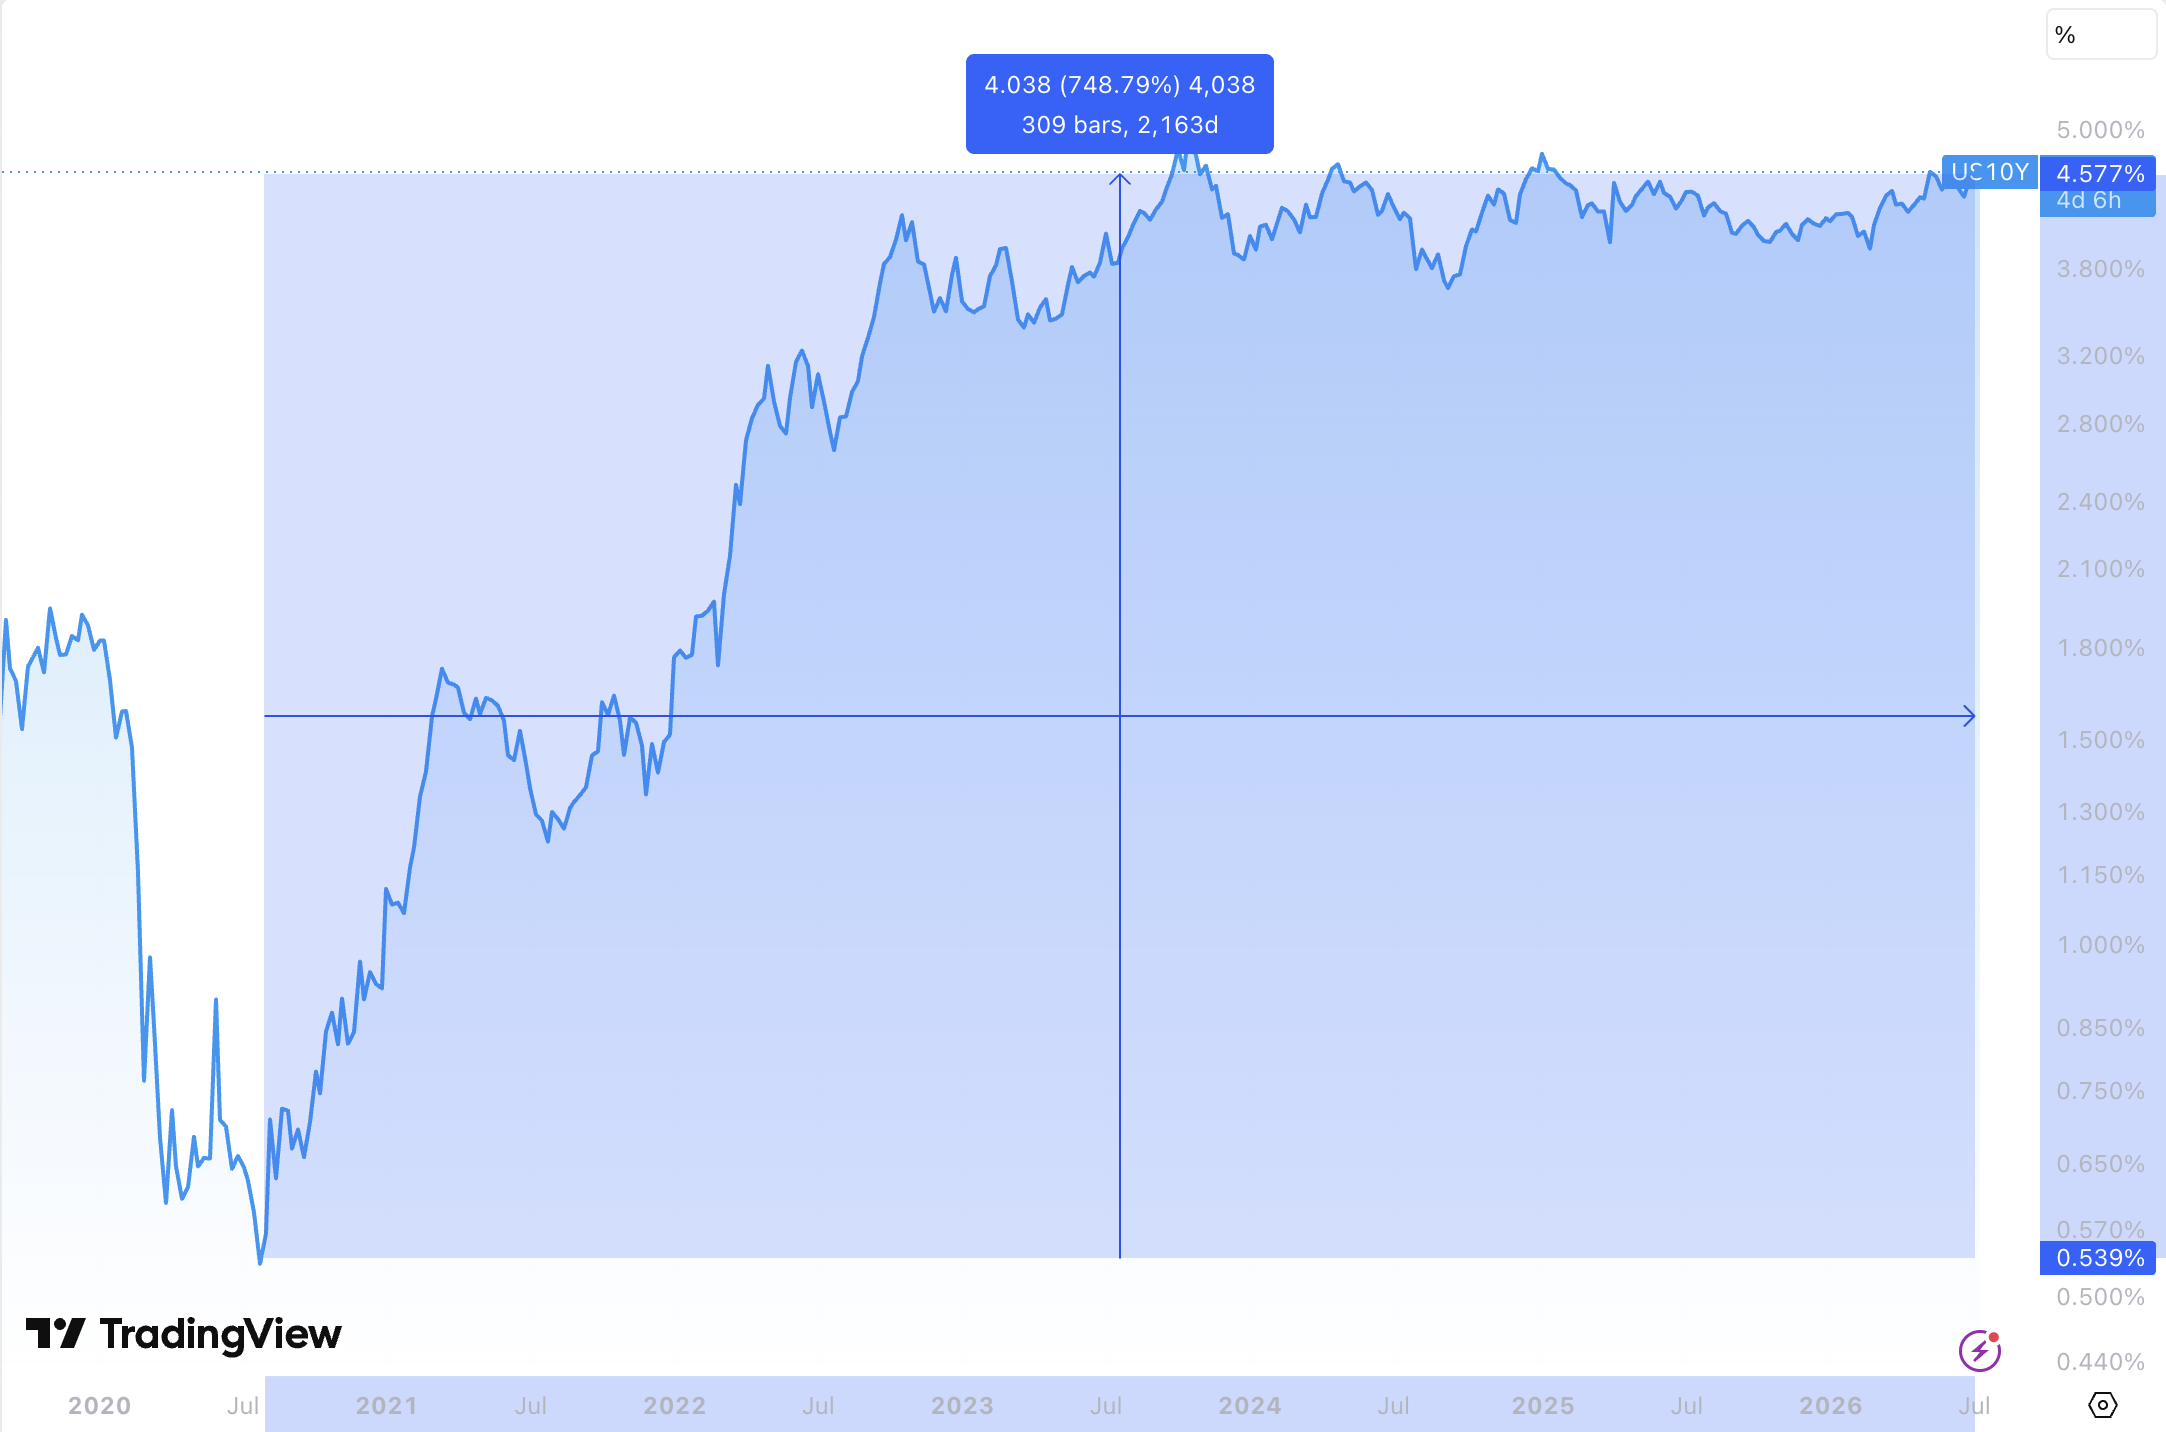
Source: TradingView US10Y data – 13 July 2026.
Inflation Reaccelerates, but Gold ETF’s Take a Hit–
U.S. headline CPI hit 4.2% in May – a third consecutive monthly acceleration and the highest print since 2023 – driven largely by a 23.5% year-on-year jump in energy costs tied to the Iran conflict. June’s CPI print, due 14 July, will show whether that energy shock has peaked or is still feeding through the economy.
Yet even as the inflation backdrop should typically support gold, investor flows have moved the other way. World Gold Council data shows gold ETFs shed 16 tonnes in May, with redemptions continuing into June, leaving roughly 298 tonnes of ETF gold underwater by close to $4 billion. Capital has instead rotated back into technology stocks, capping gold’s rallies even as the macro backdrop turns more supportive for the asset.
These backdrop factors are the tailwinds that have pushed gold from under $2,000/oz to over $4,000 in the last 3 years – namely unsustainable debt burdens on sovereign balance sheets with elevated interest rates, which place a heavy burden on state finances to meet rising interest payments. This requires increased taxes and deficit spending by governments, which result in higher inflation, currency debasement and lower growth.
Average debt-to-GDP today amongst developed G7 nations sits at above 110% - roughly double than at the time of the GFC in 2008. Since then to about 2021’s Covid era, debt piled up in a near-zero world with near zero interest rates. Today, it’s several hundred percent higher.
Central Banks Demand Remains Strong, Gold Overtakes Treasuries –
The structural, longer-term demand picture looks very different from the short-term trading tape. The World Gold Council’s 2026 Central Bank Reserves Survey – a record 76 respondents – found 89% of reserve managers expect global central bank gold holdings to keep rising over the next 12 months, with a record 45% planning to add to their own reserves. China, Uzbekistan and Poland led fresh buying in June, continuing a run that has seen central banks add an average of roughly 1,000 tonnes a year over the past four years – more than double the 2010–2021 average.
The European Central Bank confirmed in June that gold has overtaken U.S. Treasuries as the world’s largest reserve asset for the first time since 1996 – hard confirmation of the dedollarisation trend we’ve flagged in previous notes. That buying in the official sector continues regardless of the price gold is trading at and remains the clearest structural floor under the metal – along with strong physical demand in bar, coin and jewellery markets.
What’s Happening to Gold
Gold has had a volatile six months. After topping out at a record $5,593/oz at the end of January, the metal fell as low as roughly $3,960/oz in late June – a drawdown of close to 30% – before stabilising. It is currently trading around $4,100/oz (R67,256/oz), broadly flat but still well below where it started 2026.
This notable correction was expected and necessary, in order to remove the overdone speculations that drove the price over $1,000 in under a week at the start of the year. These participants included algorithmic traders and overcrowded the market.
In addition, whilst private investors and consumers tend to buy physical gold for capital appreciation and inflation hedging, professional markets use gold as insurance and risk mitigation across their portfolio makeup i.e it reduces the risk for a given expected return. So, when asset prices take a sudden move down, gold is usually liquidated to cover stop loss orders and other more leveraged bets – also sending the gold price down in conjunction.
The Iran conflict’s effects on markets is a live test of gold’s safe-haven credentials. In our previous notes, geopolitical escalation was consistently gold-supportive; this time, higher USD bond rates and a hawkish Fed have so far outweighed that instinct, keeping the metal capped even as oil spikes and tensions resume. This is more technical than fundamental – and remains short-term, driven by the very forces that will bolster the gold price going forward, and hence it’s safe haven appeal.
That’s showing up in bank forecasts. Where Standard Bank was calling for $7,000–$10,000 gold as recently as April, most major banks have since cut their targets materially: Goldman Sachs trimmed its 2026 year-end target by $500 to $4,900, Deutsche Bank cut its Q4 forecast 17% to $4,800 and JPMorgan slashed its year-end target from $6,000 to $4,500 (seeing $4,300 in Q3).
The World Gold Council itself has flagged $4,000 as a psychological floor, stating in its latest half-yearly report: ‘Under these [current] conditions, gold will likely stay relatively rangebound (±5%). But the stage is set for a possible breakout. On the upside, clear catalysts – a worsening economy or renewed geopolitical shock, a shift towards lower interest-rate expectations, or a wave of dip buying – could reignite gold’s momentum and lift it back towards US$4,500/oz or above. If the signals are strong, gold could push even higher. Conversely, an environment of resilient growth, rising yields, and calmer markets could see gold slip further – though a fall of more than 10% from current levels may be tempered by bargain-hunting demand.
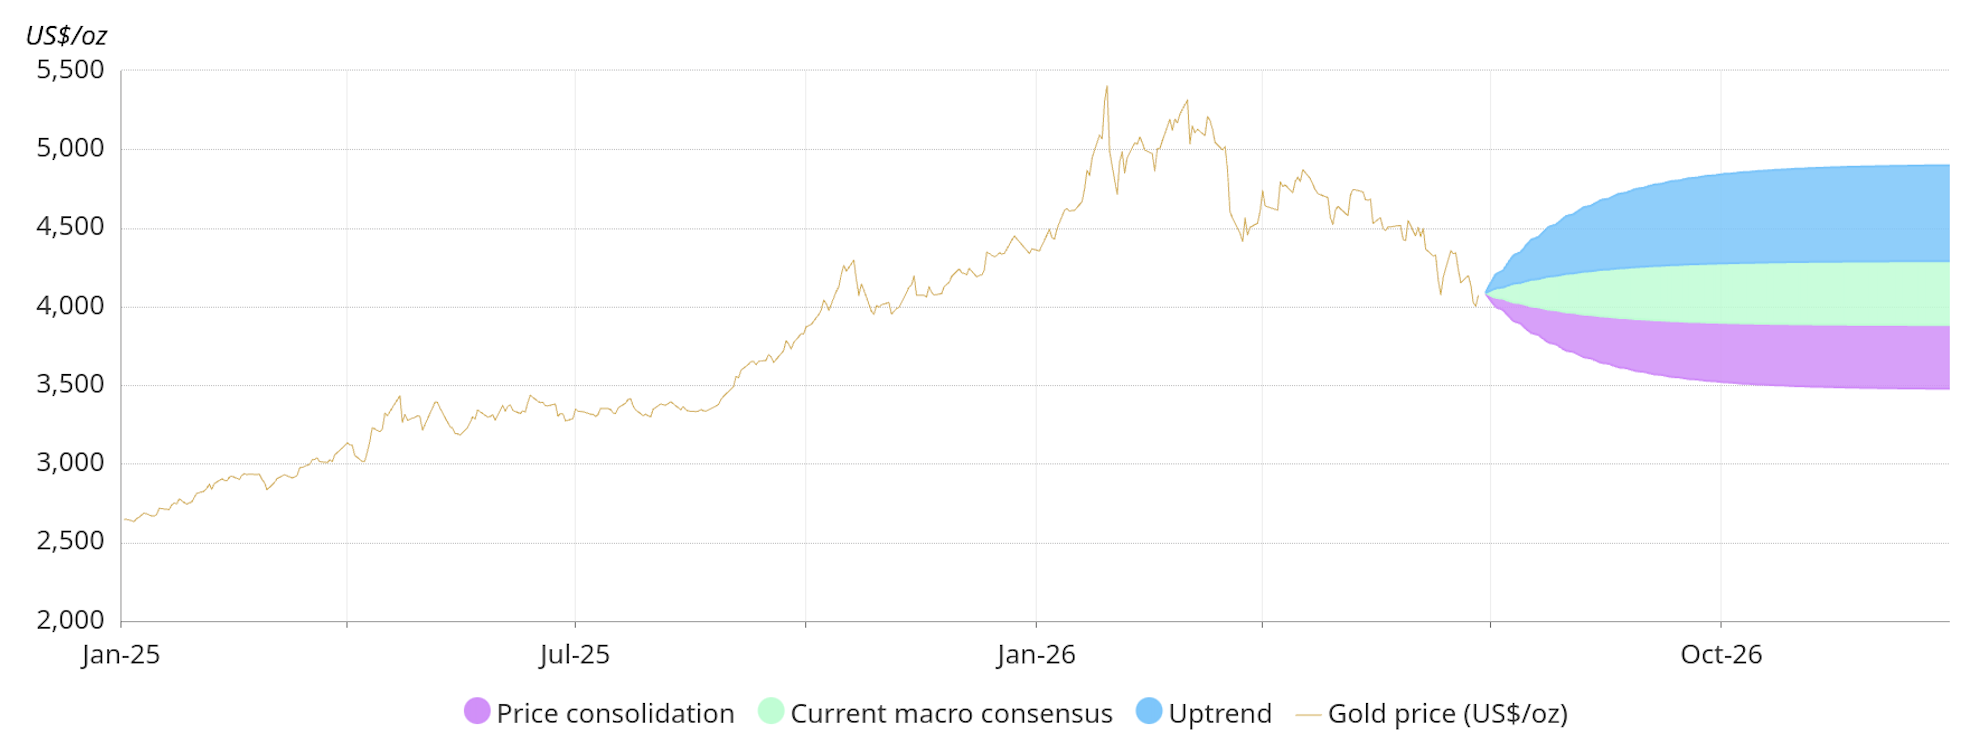
Source: World Gold Council Gold Mid-Year Outlook 2026 – 1 July 2026.
It’s important to see it in context though – that over the past 3 years, the gold price in USD terms has doubled from just under $2,000/oz to over $4,000. In Rand terms, over the same period, the price has similarly jumped from R34,000/oz to R67,000. That translates into a compounded annual return of 26% and 25% respectively.
Ultimately, the debasement trade and de-dollarisation themes that drove gold’s structural bull run remain intact – government debt levels, deficit spending and central bank accumulation haven’t reversed. What’s changed is the near-term calculus: a resurgent dollar, higher-for-longer rates and ETF outflows are, for now, outweighing the safe-haven bid from a reignited Middle East conflict. The 29 July Fed rates decision, and however the Hormuz situation resolves, will likely set the tone for gold into Q3 and Q4.
The yellow metal was last seen trading at $4,089/oz and ZAR 66,744/oz.
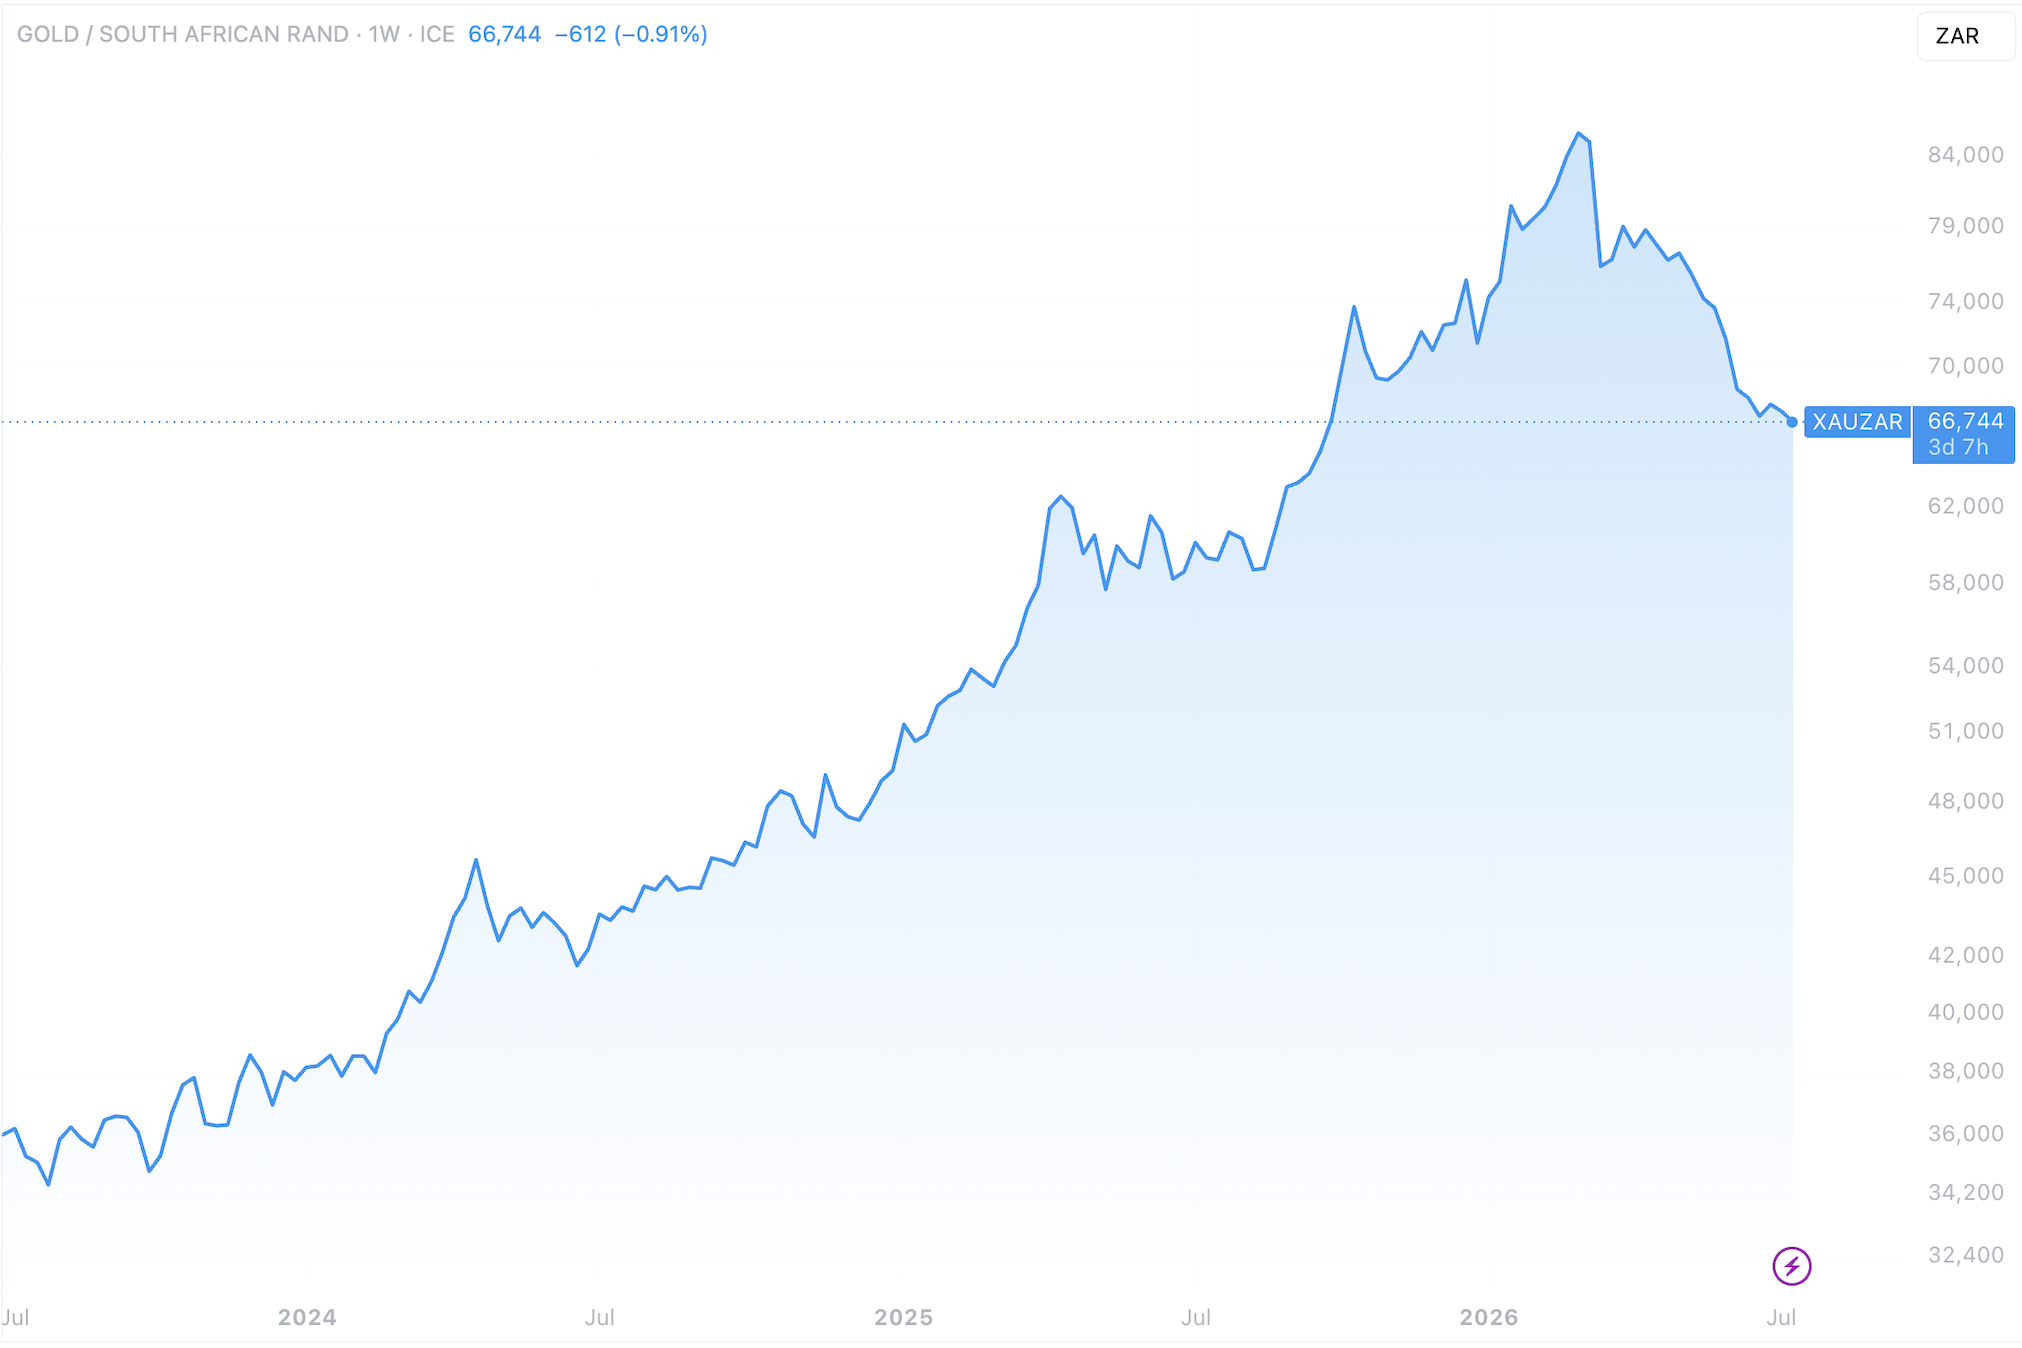
Source: Goldprice.org – XAUZAR (3-Year), 14 July 2026.